CONNECTED THROUGH DATA:

Uncovering Disparities in Cervical Cancer

By Jess Donovan, MPH (MN Community Measurement) & Matt Flory (American Cancer Society)

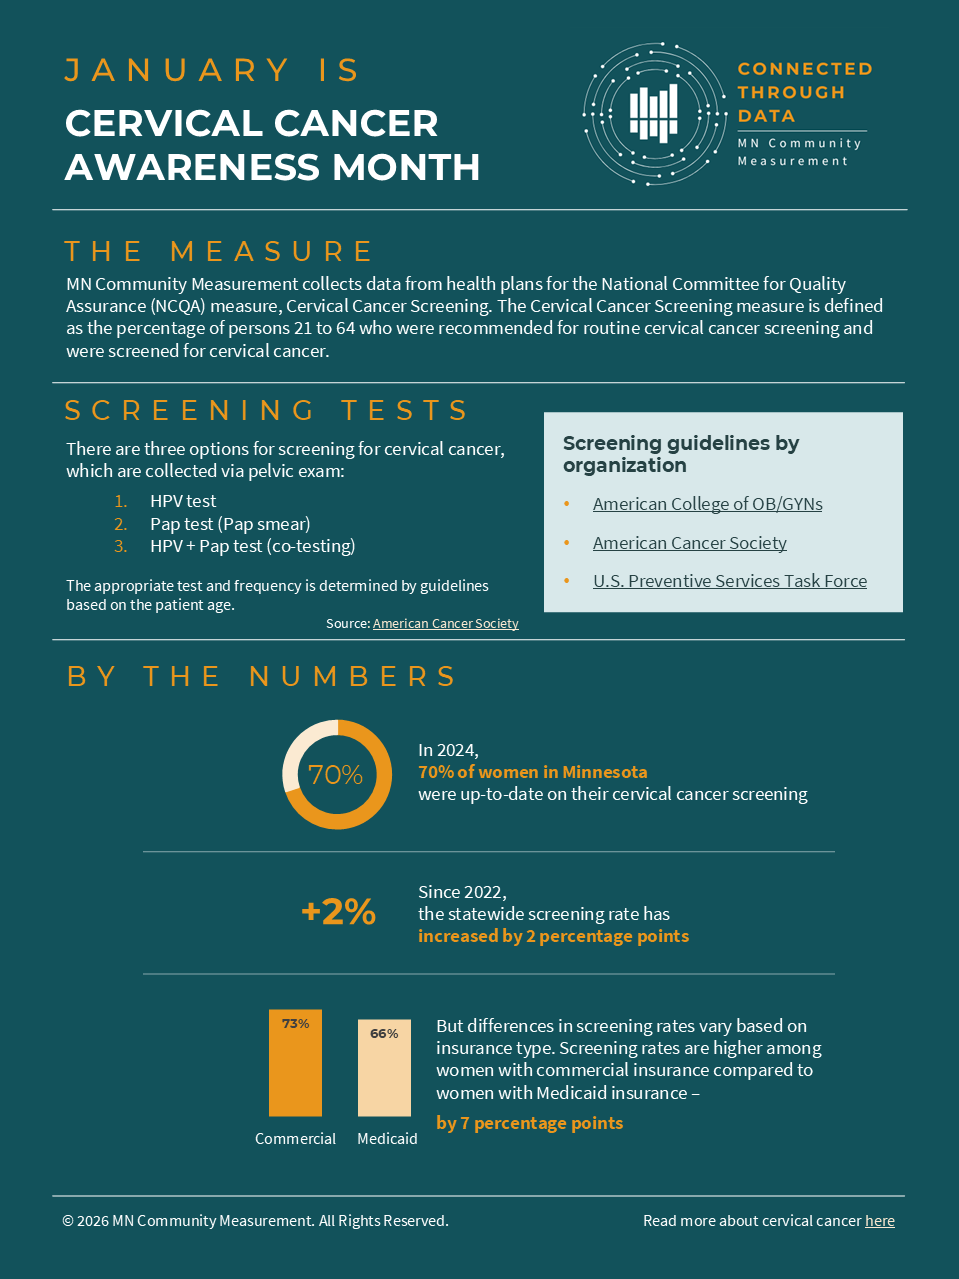
Click to view infographic

As we kick off MNCM’s 2026 infographic series, we’re putting the spotlight on cervical cancer. Cervical cancer, which is primarily caused by persistent infection with the human papillomavirus (HPV), was once the most common cause of cancer death in American women.1,2,3 Fortunately, since the development of the HPV vaccine and screening, the rate of death from cervical cancer has dropped more than half since the mid-1970s.2 In fact, cervical cancer is the 22nd cause of new cancer cases, accounting for approximately 0.7% of all new cancer cases.1 Compared to breast cancer, which is the number one cause of new cancer cases (15.5% of new cases), cervical cancer is considered rare.1 Prevention through vaccination and screening is key.


Cervical Cancer Screening Tests

Three methods are available for cervical cancer screening, and the most suitable choice depends on current guidelines and the individual's age:4

1.     High-risk HPV test (hrHPV)

2.     Pap smear (cytology)

3.     HPV + pap smear (co-testing)

Disparities in Cervical Cancer

Despite the advancements made in the prevention and vaccination space, there remains differences in both diagnosis and death rates, particularly by age and race/ethnicity group.


Age

Women between the ages of 35 to 64 are the most frequent age group diagnosed with cervical cancer, with the median age at diagnosis being 50.1,2 However, women in the 55-64 age group have the highest percentage of cervical cancer deaths, with the median age at death being 60.1


Race/Ethnicity

In Minnesota, women of color are more likely to be diagnosed with late-stage cervical cancer, making it difficult to treat.3   Women who are Indigenous/Native are four times more likely to be diagnosed with late-stage cervical cancer compared to white, non-Hispanic women.3 At the national level, Indigenous/Native and Black women have the highest rate of death from cervical cancer compared to other race groups.1,2


Cervical Cancer Screening Measure

The Cervical Cancer Screening measure is stewarded by the National Committee for Quality Assurance (NCQA) and is reported to MN Community Measurement by health plans. The measure is defined as:


The percentage of women who were screened for cervical cancer using any of the following criteria:

  • Women 21-64 years of age who had cervical cytology performed within the last 3 years.
  • Women 30-64 of age who had cervical hrHPV testing performed within the last five years.
  • Women 30-64 years of age who had cervical cytology/hrHPV co-testing within the last five years.


What MNCM Data Show

In 2024, approximately 70% of women in Minnesota were up-to-date on their cervical cancer screening. Since 2022, the statewide screening rate has increased by two percentage points. However, differences in screening rates varied by insurance type, with 73% of women with commercial insurance and 66% of women with Medicaid being up-to-date with their screening.


Why This Matters

The significant decline in the number of new cervical cancer highlights the importance of routine screening and vaccination for cancer prevention. The HPV vaccine can help prevent 90% of cervical cancers, and recent data shows a 79% decrease in cervical precancers among women aged 20-24, which is the group that is most likely to have been vaccinated against HPV.5 As a result, the Minnesota Department of Health and the American Academy of Pediatrics recommends that all adolescents (females and males) receive the HPV vaccine series between the ages of 9 and 12 years of age. In addition to vaccination, keeping up-to-date on cervical cancer screenings as recommended by health care providers can help catch cancer early and make it easier to treat.


There is still work to be done to address disparities in cervical cancer incidence and mortality. And, the effort should be a collaborative one. All sectors of the community should have a seat at the table, including but not limited to health care providers, local and state public health, tribal health, payers, community organizers, and patients. Together, we can work to close these gaps and save lives.


References

  1. National Cancer Institute. Cancer Stat Facts: Cervical Cancer. Surveillance, Epidemiology, and End Results Program. Retrieved from https://seer.cancer.gov/statfacts/html/cervix.html
  2. American Cancer Society (2026). Key Statistics for Cervical Cancer. Retrieved from https://www.cancer.org/cancer/types/cervical-cancer/about/key-statistics.html
  3. Minnesota Department of Health (2025). Cervical Cancer in Minnesota. Fact Sheet. Retrieved from https://www.health.state.mn.us/data/mcrs/docs/cervicalfs.pdf
  4. American Cancer Society (2025). The American Cancer Society Guideline for Cervical Cancer Screening. Retrieved from https://www.cancer.org/cancer/types/cervical-cancer/detection-diagnosis-staging/cervical-cancer-screening-guidelines.html
  5. Gargano JW, Stefanos R, Dahl RM, et al. Trends in Cervical Precancers Identified Through Population-Based Surveillance — Human Papillomavirus Vaccine Impact Monitoring Project, Five Sites, United States, 2008–2022. MMWR Morb Mortal Wkly Rep 2025;74:96–101. DOI: http://dx.doi.org/10.15585/mmwr.mm7406a4
  6. Minnesota Department of Health (2026). Vaccines for Infants, Children, and Adolescents. Retrieved from https://www.health.state.mn.us/people/immunize/basics/kids.html#schedule


Recent Posts

May 27, 2026
MNCM’s President & CEO Liz Cinqueonce Joins Great Lakes Executive Leadership Council Advances Regional Collaboration and Quality Improvement
By Elizabeth Cinqueonce May 13, 2026
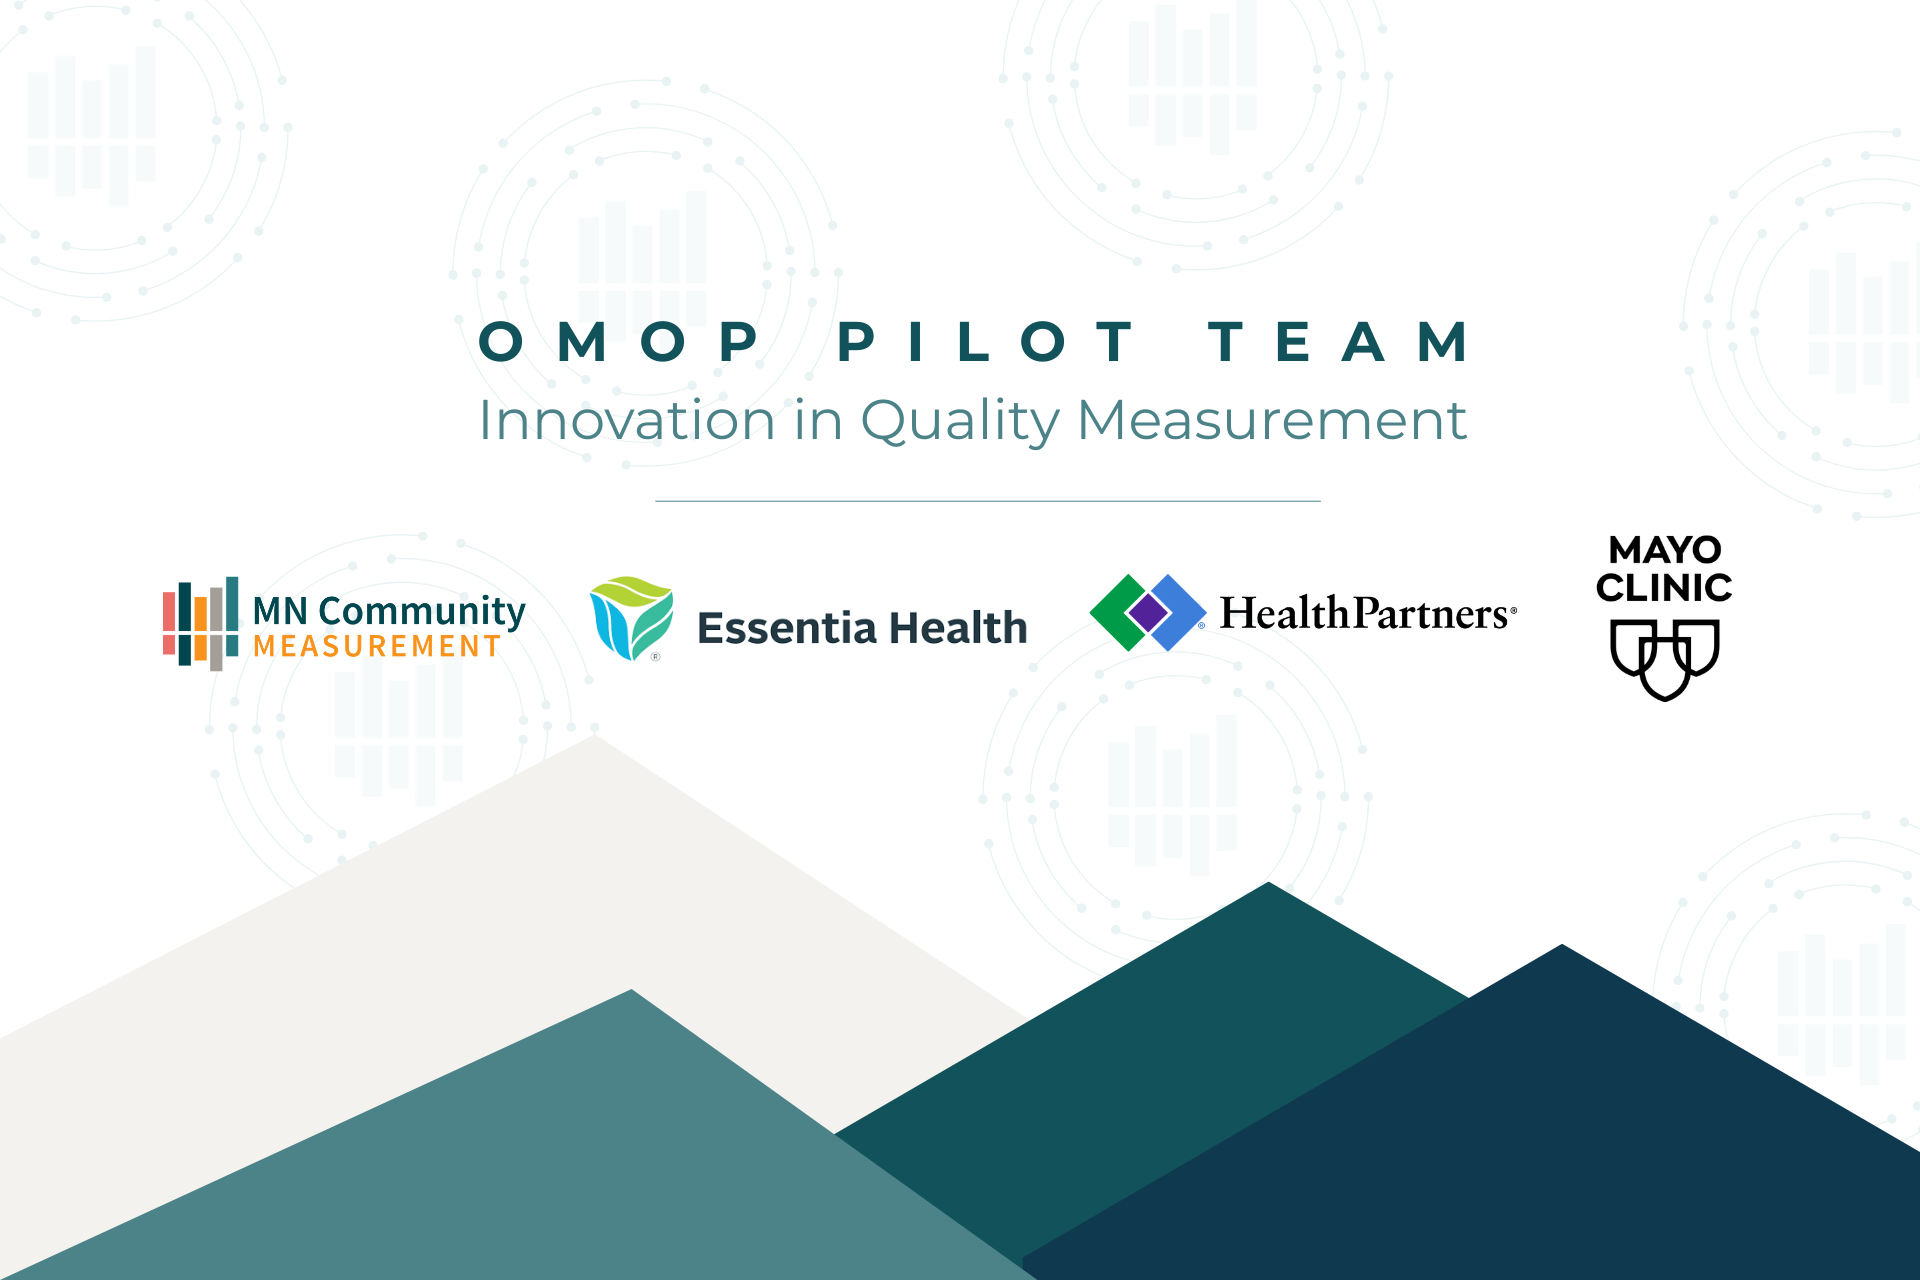
MN Community Measurement Recognizes Innovation and Collaboration in Clinical Quality Measurement
By Jessica Donovan April 29, 2026
MN Community Measurement (MNCM) has released two new reports highlighting the state’s health care performance: Health Care in Minnesota: Summary Report on Quality, Disparities, and Cost and Health Care in Minnesota: Health Care Quality Leaders . Together, these reports provide a comprehensive analysis of 2024 data, examining trends in health care quality, disparities, and costs, while also recognizing medical group quality leaders and those demonstrating meaningful improvement. These reports, based on data submitted to MNCM in 2025 and reflecting care delivered in 2024, work in tandem with MNCM’s Performance Hub —an interactive platform providing statewide analyses of health care quality and cost measures. Collectively, these tools equip community partners, including medical groups, payers, policymakers, public health agencies, researchers, and community-based organizations, with actionable insights to drive improvements in care and advance health equity across Minnesota. Report highlights include: Health Care Quality Significant gaps remain in asthma control, with thousands of patients needing improved care to meet statewide benchmarks. Colorectal cancer screening rates for the newly eligible 45-49 age group continues to improve. While the 2024 rate for all age groups has significantly increased compared to 2023, it remains significantly lower than 2021. Childhood immunization continues to show a decrease in statewide rate from year to year. This measure has not shown improvement in rates following the COVID-19 pandemic. There were modest improvements in breast cancer screening, cervical cancer screening, controlling high blood pressure, diabetes eye exams, and immunizations for adolescents. Health Care Disparities Black, Indigenous, Multi-Race, and Hispanic/Latinx patients experienced the most disparities across multiple measures, particularly in Colorectal Cancer Screening. Patients speaking Somali and Spanish, as well as those from Laos, Mexico, and Somalia, had lower rates of preventive care and chronic disease management compared to statewide averages. Cost and Utilization The total cost of care increased by 7.3% in 2024, primarily driven by an 8.9% rise in pharmacy costs and an 8.3% rise in professional fees. All categories of medical services saw increased use, except for inpatient admissions. Women aged 36-64 had the highest number of claims, while men aged 18-35 had the lowest number of claims. Quality Leaders In 2024, 31 medical groups were recognized as quality leaders across the measures reported by medical groups. In 2024, 58 medical groups were recognized as quality leaders across the measures reported by payers. 
By Elizabeth Cinqueonce March 5, 2026
Aligning for Impact: Minnesota's Health Data Evolution A 2026 Leadership Series from the MNCM Board Chair & President
By Jess Donovan, MPH, BSN October 21, 2025
This October marks the 40th anniversary of Breast Cancer Awareness Month. According to the American Cancer Society, about 1 in 8 women will be diagnosed with invasive breast cancer in their lifetime. Fortunately, however, early detection through screening and advances in treatment have decreased mortality by 44% since 1989. Screening can catch cancer early, when it is… The post Empowered by Data: Uncovering Screening Disparities and Reducing Breast Cancer Risk appeared first on MN Community Measurement.

Recent Comments

Archives

Categories